
What Increases Conversions on a Product Page
Search "what increases conversions on a product page" and you get the same twelve tips every time: better photos, trust badges, urgency banners, a faster page. Some of that is true. None of it is the actual lever. We have rebuilt product pages for enough brands to know the biggest wins come from decisions made before anyone touches a headline, not from swapping a button color.
What increases conversions on a product page, in order
The size of a win is mostly decided before the page is even written. In our experience running these tests, the leverage stacks in a fairly consistent order:
- What the visitor lands on. An ad for one product that lands on a home page or a broad collection makes the visitor hunt for what they came for. Most will not bother.
- What kind of page it is. A product page describes a product. An offer page argues for buying it right now. Those are different jobs, and they convert differently.
- How the page is built. Layout, proof, copy. Real, but a smaller lever than the two above.
- Single element changes. Button color, badge wording. At this scale, close to noise.
Most advice, and most agencies, only work on the third and fourth item. That is why the advice all sounds the same.
The page you send traffic to is the biggest lever you are not testing
When Eiyan Lens sent Google Ads traffic to an offer page instead of their home page, revenue per visitor rose 52%. Same product, same ads, same budget. The only change was what the click landed on.
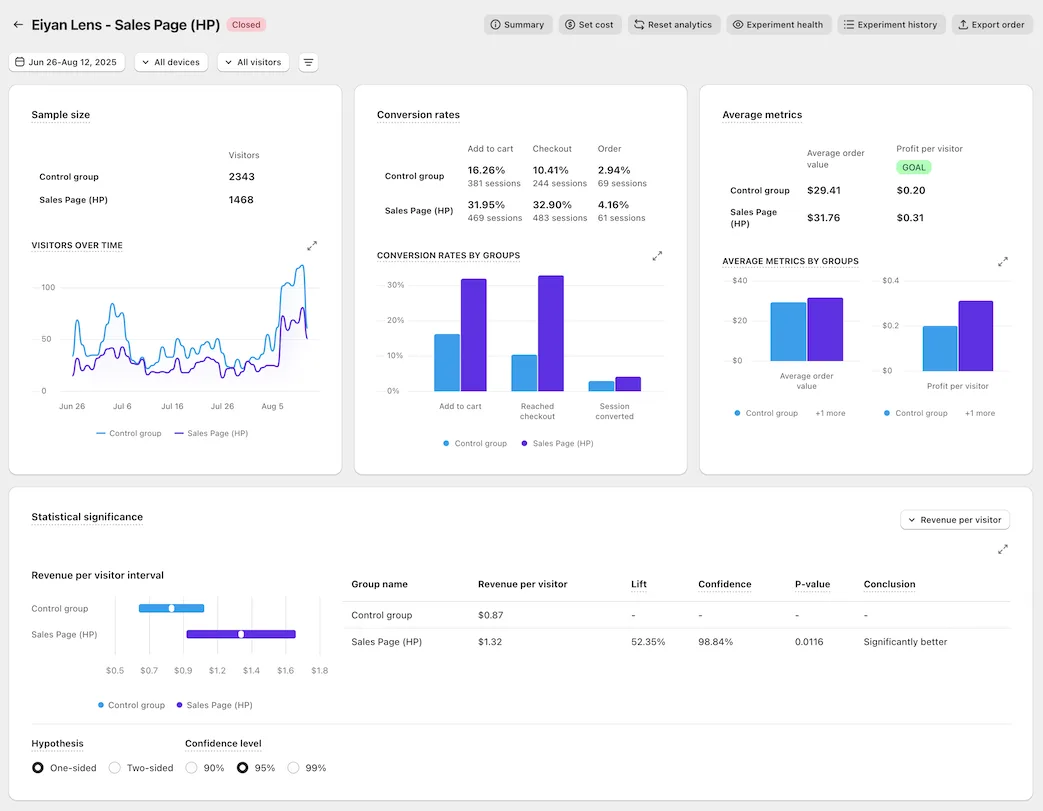
Free the Roots saw the same pattern from a different angle. Sending Meta traffic to an offer page instead of a collection page lifted revenue per visitor 33%, measured in ABConvert. DuraDry ran an offer page against their own product page on Google Ads traffic and came back 45% higher, tracked in VWO over two weeks. Three different traffic sources, three different verticals, one repeated result: the page you point traffic at matters more than almost anything you do to that page afterward.
This is why we do not touch copy first when we rebuild a page. We decide what kind of page the traffic needs, then build.
The offer architecture most product pages get wrong
Once the right kind of page exists, the next lever is how the offer is structured. Most product pages show one price and one buy button. That is a missed opportunity, not a clean design choice.
What actually works:
- Tiered choice with a decoy. Three options in visual order: the best value tier badged as such, a middle tier badged most popular, and a single purchase option shown small and unbadged, there to make the other two look obviously smarter.
- Unit economics beside every price. A large number shrinks the moment it is divided into a price per use.
- A genuine anchor price, struck through. The discount is the story, and the story only works if the reference price is real.
- Value stacked, not just discounted. List what is included free, price each item, total it. A pile of value that outweighs the discount beats a deeper discount.
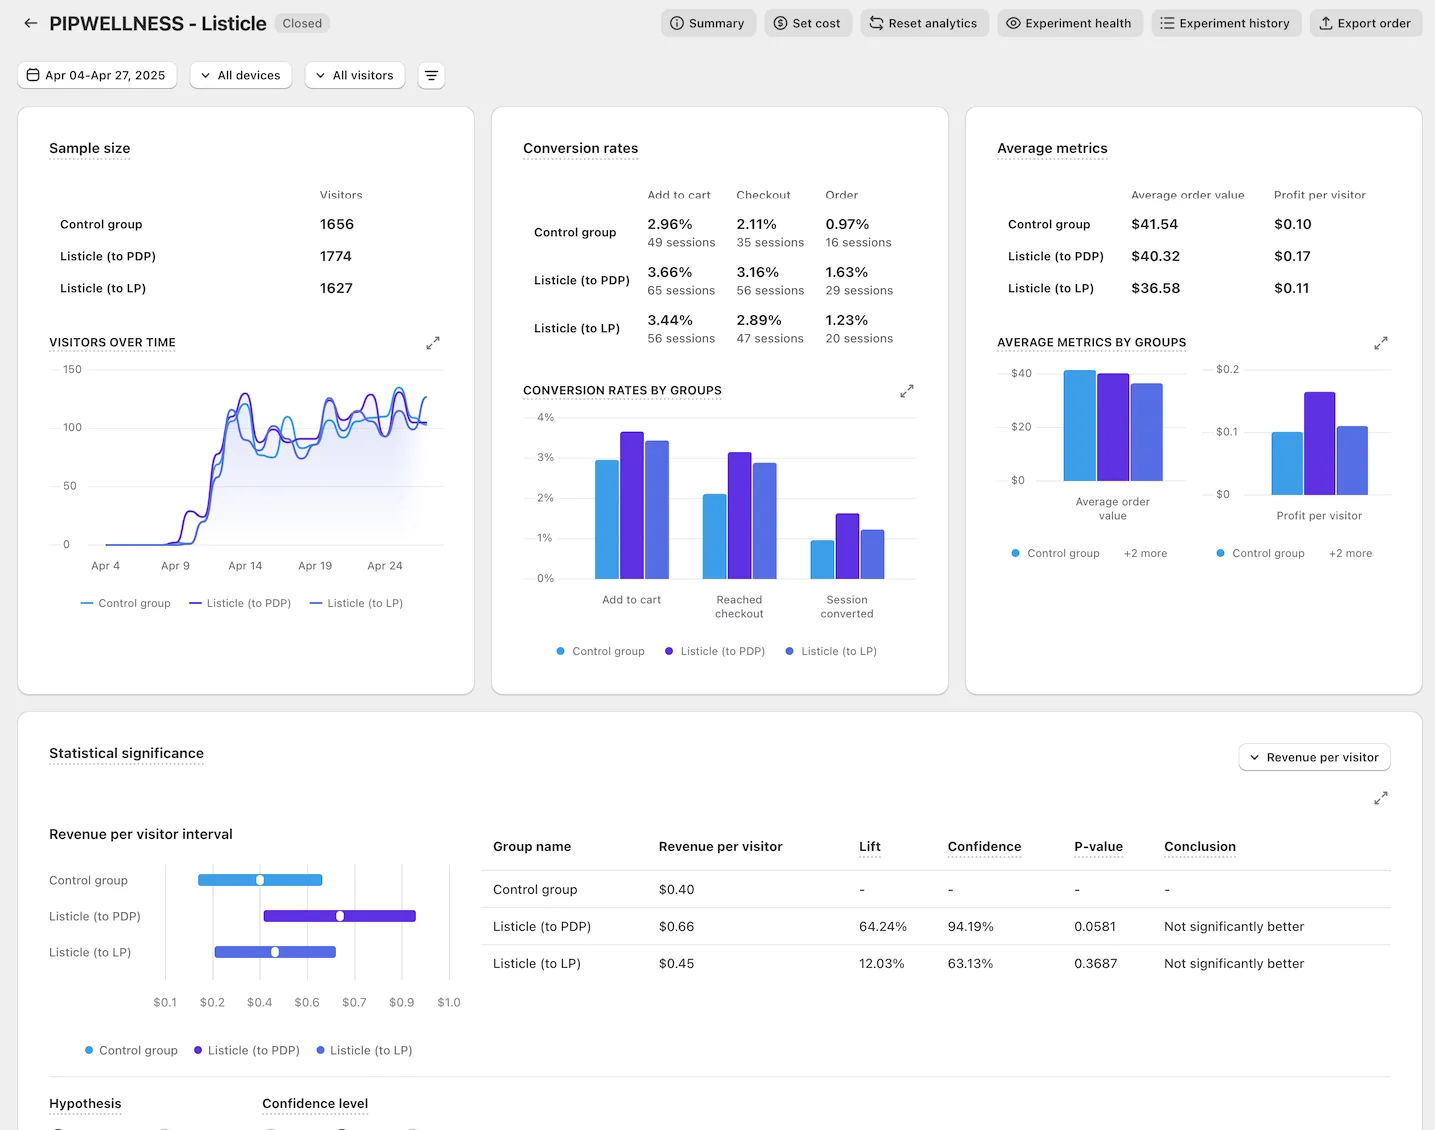
PIP Wellness tested a listicle style offer page against their product page on Meta traffic, and revenue per visitor went from $0.40 to $0.66, a 64% lift, read in ABConvert. That is not a copy tweak. That is a different offer, argued differently.
Gum of Gods ran our offer page against their own offer page, both on Meta traffic, and still came back 97% higher. The lesson there is not that any offer page wins. It is that the architecture inside the offer page is its own lever, separate from the decision to build one at all.
Proof belongs in a specific order, not everywhere
Catalog what a brand genuinely has before writing a single proof section. Founder credibility, ambassador credentials, a genuine clinical result, third party testing, reviews. Rank what is real, then place the strongest piece above the fold or in the first scroll, and let the deeper proof earn the middle of the page. A brand with thin proof should get a shorter page, not a padded one.
A page that lifts conversion rate and drops revenue per visitor has lost.
That line matters because it is the whole reason we do not optimize for conversion rate. Conversion rate can be pushed up by discounting hard or featuring a cheaper item, while the business earns less on every visitor who arrives. Revenue per visitor contains conversion rate and order value at once, so it cannot be gamed that way. Every number above is read the same way: the new page against the brand’s own current page, split on their own live traffic, pulled from the testing platform itself, never from ad platform reported revenue.
What this means for your page
Prime Natural and Snuff Cup posted 307% and 310% lifts, and both are labeled small sample. That is not us hedging. A large lift on a small sample is a direction worth testing further, not yet a settled result, and the honest way to report it is exactly like that. Bareline ran a template level test across 92,484 sessions and came back at 13.5% with 99% probability to win, which is a different kind of confidence entirely.
If you want to see how each of these tests was actually structured, the full breakdown lives on /results/. And if you would rather skip the diagnosis and just get a page rebuilt against a guarantee, that offer and its terms are laid out on /guarantee/.
See it on your own page.
We rebuild your highest-leverage page and prove the lift on your own live traffic. A 10% lift in revenue per visitor, or your money back.
Book a call