
Conversion Rate vs Revenue Per Visitor: The Math That Matters
Conversion rate vs revenue per visitor is not a semantic argument, it is the difference between a page that looks like it won and a page that actually made the business more money. We have run this comparison inside 15 measured tests, and the pages that won on conversion rate were not always the pages that won on revenue.
Why conversion rate can mislead you
Conversion rate answers one question: what percentage of visitors bought something. It does not ask what they bought, or at what price, or whether the win was manufactured with a discount. A cheaper product pushed to the front of a page will lift conversion rate every time, because more people can afford it. The business earns less per order while the dashboard says the test won.
Revenue per visitor asks the only question that matters to the business: how much did each visitor generate, on average, across the whole traffic. It is total revenue divided by total visitors, so it carries conversion rate and average order value inside the same number. A discount, a cheaper SKU pushed forward, a coupon that drags more people to checkout, none of it can hide inside revenue per visitor the way it hides inside conversion rate. If the discount worked, revenue per visitor shows it. If the discount just moved cheaper buyers through the funnel faster, revenue per visitor shows that too.
A page that lifts conversion rate and drops revenue per visitor has lost, even though the report says it won.
The math that actually matters
Take two versions of a page. Version A converts at 3%, version B converts at 3.4%. On conversion rate alone, B wins. Now add average order value: A closes at $80 a cart, B closes at $58, because B’s copy nudged buyers toward the cheapest tier. Multiply it out and A generates more revenue per visitor than B does. This is not a hypothetical, it is the exact failure mode a conversion rate only test walks straight into, and it is why every result we publish is read as revenue per visitor from the A/B testing platform, split on the brand’s own live traffic, never from ad platform reported revenue, which attributes generously and cannot see what the page itself did.
What moves revenue per visitor, in order
The size of a win is decided mostly before anyone touches a headline or a button color. In our experience, the leverage sits in this order:
- What the visitor lands on. An ad for one product that lands on a home page or a broad collection makes the visitor hunt for what they came for. Most will not bother.
- What kind of page it is. A product page describes a product. An offer page argues for buying it now. Different jobs, different conversion.
- How the page is built. Real, and where most brands start, but a smaller lever than the two above.
- Single element changes. Button color, badge wording. Close to noise at this scale.
This is where most conversion rate vs revenue per visitor confusion starts. Teams spend weeks on the smallest lever, a button test, and expect it to move a number that is mostly decided by what page type the ad even lands on.
What the offer page has to do
We build the replacement page as an offer page, not a second product page, because a product page and an offer page do different jobs. The strongest version stacks three tiers with a genuine decoy: the best value tier badged as such, a middle tier badged most popular, and a one time purchase shown small and unbadged, there only to make the other two look like the obvious choice. Every tier carries its unit price, per serving or per day, because a large number shrinks the moment you divide it. Any discount is anchored against a real struck through price, never an invented one. And the strongest proof the brand actually has, not proof we invent, sits in the first scroll.
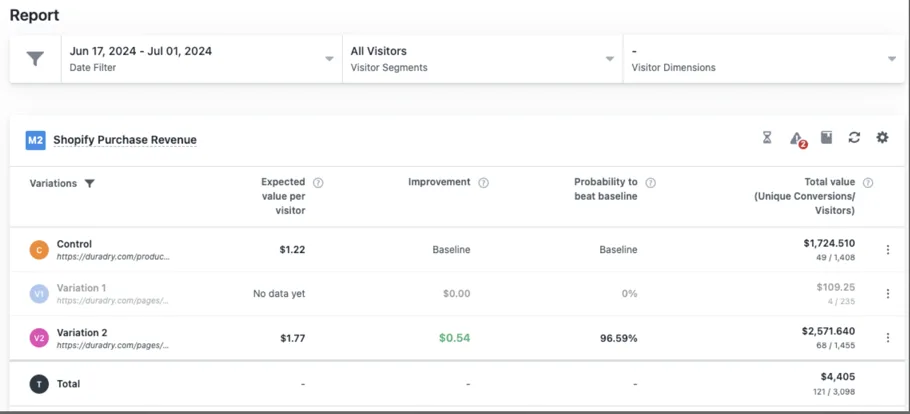
DuraDry’s offer page beat their own product page by 45% in revenue per visitor, on Google Ads traffic read through VWO across two weeks. Free the Roots beat a collection page by 33%, on Meta traffic through ABConvert. Both wins came from the page type and the offer architecture, not from a button.
Reading the result honestly
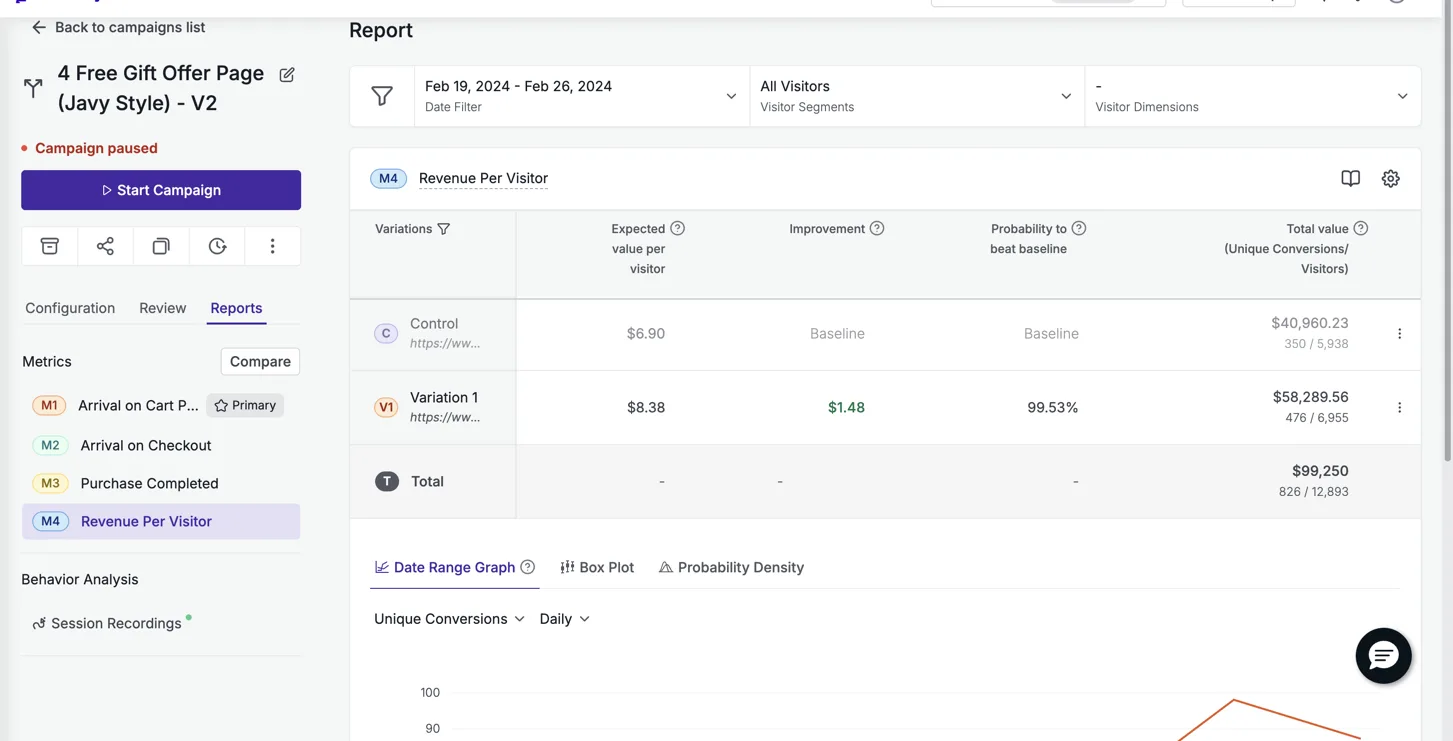
A large lift on a small sample is a direction, not a result. Prime Natural moved revenue per visitor by 307%, which is real and worth noting, and it is also a small sample result, so we say that plainly rather than let the headline number do the talking alone. Particle for Men moved revenue per visitor by 21.4% at 99.5% confidence across 12,893 visitors, and the offer page is still live two years later, which is a different, sturdier kind of proof. A winner that runs at full traffic for a long time will usually read lower later than its controlled test showed. That is decay, not a lie about the original number, which is why the honest thing to publish is always the controlled result with its method attached.
We have worked with 400+ ecommerce brands. Fifteen of those relationships produced a measured, controlled result we can show you, and every one is on /results. If you want to see what a rebuild would look like on your own page, tested against your own traffic and read the same honest way, the offer and the guarantee are laid out on /guarantee.
See it on your own page.
We rebuild your highest-leverage page and prove the lift on your own live traffic. A 10% lift in revenue per visitor, or your money back.
Book a call